Recommender systems suggest users specific content according to their preferences, by predicting the users' rating or preference of items.
If this doesn't ring a bell, let me tell you how common recommender systems are in your world.
- Shopping sites, such as Amazon, eBay, and AliExpress, recommend items to purchase based on your previous purchases.*
 |
| Amazon recommended me to buy a recycling bin sticker because I had recycle bins in my shopping basket |
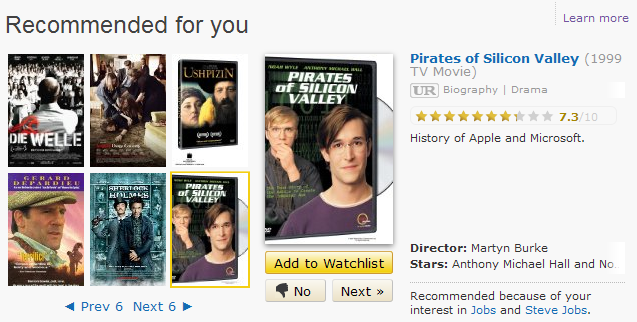
- IMDB recommends movies you might like, based on your other movie ratings.
 |
IMDB recommended my husband to watch "Pirates of Silicon Valley", based on his interest in similar movies.
|
- Music sites, such as Rdio, Spotify and the late GrooveShark, recommend artists similar to the artists you listen to.
 |
| Rdio suggested artists that it considered similar to those I've been listening to |
|
- And of course, YouTube recommends videos based on your previous watches.
 |
| YouTube identified that I like budgies and Muse and that I'm a beginner electric guitar player |
You can't overestimate the business value of these recommendations. Studies have shown that they increase sales. So how does Amazon know which products are likely to interest me? How does Rdio know to recommend I listen to Kings of Leon and would never recommend listening to Taylor Swift? In general, these systems know that I like certain products/artists/movies/videos and would like to predict other products/artists/movies/videos I might like. Many of these systems use a quite simple algorithm, called
Collaborative Filtering.
Collaborative Filtering
Let's take music recommendation as an example. The system has many registered users, and many artists. For simplicity, assume that rating applies to artists rather than albums or songs. Users can rate artists in a scale of 1-5. An average user would rate a few artists; there would still be many other artists that he doesn't rate, either because he doesn't know them or because he didn't listen to them through the website.
In many cases, the user doesn't actively rate the artist, but the system infers a rating based on the user's behavior - for example, if the user listened to a certain artist many times, it counts as high rating. On the other hand, if the system offered the user this artist a couple of times and he always clicked "skip", he must really not like this artist. The rating technique doesn't really matter.
User preferences are stored in a large matrix (table), in which each row represents a user, and each column represents an artist:
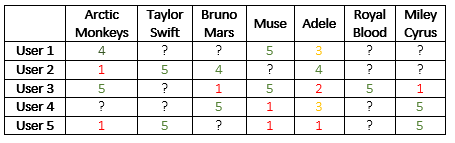 |
| A sample user artist ranking matrix. with 5 users and 7 artists. The ranking is between 1 (hate) to 5 (love). If a user hasn't ranked a certain artist, the rank is unknown and is marked with a question mark. This is a toy example; much more data is needed for accurate inference. |
The idea behind the algorithm is basically to get rid of the question marks in the matrix, and replace them with predicted ratings. The basic assumptions are:
- If I like a certain artist (e.g. Muse), I would like similar artists (e.g. Royal Blood).
- If I'm user A, and I agree with user B's ratings on many artists, I might agree with user B's ratings of other artists, which I haven't rated (and maybe don't know yet). For example, if both user B and I really love Taylor Swift and Miley Cyrus, and user B also really likes Bruno Mars, which I haven't rated, then I might also like Bruno Mars.
From these two reasonable assumptions, the algorithm diverges to two possible implementations:
- Based on user similarity
This implementation looks at a certain user and tries to complete missing ratings for this user. According to the second assumption, all we need to do is measure to what extent this user's preferences are similar to those of any other user, and then use the similar users' ratings to complete missing ratings.
It is easy to see that each user is represented by a row vector. The dimension of this vector is the number of artists, and every cell in the vector represents the user's rating of a certain artist. For example, this is user 2's vector:

We can measure the correlation of user 2's ratings with another user's rating, by looking at the subset of artists that both users rated. We treat each rating with respect to the user's average rating of artists. For example, user 2's average rating is (1 + 5 + 4 + 4) / 4 = 3.5, so his rating of Arctic Monkeys is -2.5 below the average, while his rating for Taylor Swift is +1.5 above the average. High correlation between users occurs when they have many mutual ratings with similar distance from the average. I'll spare you the formula, but let's look at an example. It seems that users 1 and 3 share a fairly similar taste in music:
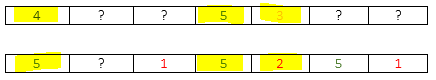 |
| Rating vectors of user 1 (top) and 3 (bottom). The mutual ratings are similar. |
While they both differ from user 5, that seems to hate both Arctic Monkeys and Muse:

If we would like to predict user 1's missing rating of Bruno Mars, we first need to find the k most similar users to user 1 that rated Bruno Mars (k being a parameter of the system). For each of these similar users, we compute the distance of their rating of Bruno Mars from their average rating. For example, +1, -2.5, etc. Then, we compute a weighted average of these distances, with the user-similarity as the weight. The weighted average means that the more similar a certain user is to the target user (e.g. user 1), the more weight we put on his preferences.
This weighted average is the predicted distance from the average rating of user 1. For example, setting k=1 will take into account user 3 as the most similar user. User 3's average rating is (5 + 1 + 5 + 2 + 5 + 1) / 6 = 3.167. The distance of his rating for Bruno Mars from the average is 1 - 3.617 = -2.617. Since we chose k=1, this would be exactly the distance for user 1. His average rating is (4 + 5 + 3) / 3 = 4, so his predicted rating for Bruno Mars is 4 - 2.617 = 1.83. Pretty reasonable considering that both users like rock, but user 1 shows more tolerance to pop music by liking Adele a bit more than user 3.
- Based on item similarity
This variant is pretty straightforward after understanding the user-based similarity. We now look at each artist as a column vector, trying to predict what users would rate this artist.
 |
| The column vector for Arctic Monkeys (left) and Muse (right). They are fairly similar in the given toy example (while not so similar in real life, given other rock artists). |
The k most similar artists of each artist are computed in a similar fashion. Again, with respect to the distance of each user's rating from his average (that's because different users have different rating scales - some are more generous than others). The predicted rating of a certain artist by a certain user is the weighted average of the ratings of this user for similar artists. For example, to predict user 4's rating of Arctic Monkeys with k=1, we simply take his rating of Muse.
Next time that some website miraculously predicts which artist/video/movie/product you would like, you should know it wasn't a wild guess but a rather simple heuristic.
* No items were purchased during the writing of this post.